As Australian investors increase their global exposure within their investment portfolios, companies such as Alphabet (GOOGL), Amazon (AMZN), Apple (AAPL) and Microsoft (MSFT) are typically the first mentioned. These names which have become synonymous as “international” investments are headquartered within the United States and despite generating revenue from around the world it is important to consider the benefits of expanding beyond the North American borders and consider alternatives from other regions such as Europe.
Similar to many other areas around the world, interest rates in Europe are expected to rise with projections for the 3-month Euribor (Similar to Australian Bank Bill Swap Rate) shown below in Figure 1. In twelve months, rates are anticipated to increase 0.9% (-0.17% to 0.73%) compared to a 1.75% rise in the Fed Fund Rate to a 3.5% median in the United States.

Figure 1: Euribor 3-Month rate and forecast (Source: Erste Group)
In rising interest rate environments, many investors pull back on their “growth” exposure and shift their tilt towards those with a “value” classification. This congregation to value companies may be one reason for their outperformance during higher interest rate periods, thus, exposure to these types of companies is important for a portfolio. Figure 2 demonstrates that value historically has outperformed growth with the recent bull run from 2008 to 2020 the outlier.

Figure 2: Value performance over Growth (Source: Kenneth French via Mercer)
The M.S.C.I Europe Index generally holds a slightly higher allocation in value companies and the concentration of cyclical sectors is elevated with both these classifications having performed relatively well in periods of inflation as a decreased sensitivity to interest rates softening any negative shocks. Figure 2 displays previous returns for different regions/classifications in an interest rate hiking environment with Europe placing equal second in performance behind S&P GSCI, which is a commodity index.

Figure 3: Return during Fed Hike Cycles (Source: Goldman Sachs Asset Management)
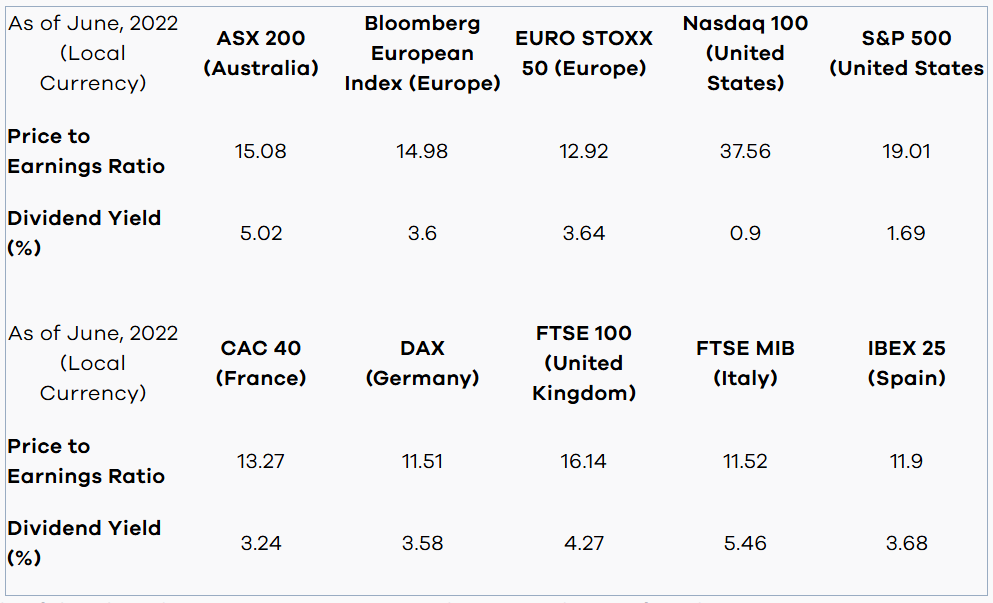
The Australian region, while not included in the above research presumably due to its inconsequential size, does excel in its dividend yield which stood at 5.02% as of June, 2022. This could be attributed to a multitude of reasons including:
• Dividend imputation policy (Franking Credits) available in Australia, not commonly available in other countries.
• Significant investment pool from Superannuation funds which may seek dividends to provide an income stream.
• Less progressive/risk taking culture of citizens/government limiting start up and growth opportunities which directs investments into established and safer endeavors which tend to be value companies that generally provide higher income distributions.
• Australia residents’ proclivity for dividends due to multiple factors including those above.
While they may not match the level offered in Australia, many countries throughout Europe also offer attractive yields with Italy even topping the rate at 5.46%. Additionally, the price-to-earnings valuations are currently lower than Australia and the United States, with the FTSE 100 an exception, which indicates that they are “cheaper”, meaning that it cost less to buy these companies for each dollar of earnings they generate. Although not a certainty, as investors become increasingly selective, these possibly undervalued companies could see higher capital returns in comparison to other markets.

Outside of the tilt in the European region towards sectors that perform better in rising interest rate environments and attractive dividend yields, the following reasons should also be considered benefits:
• Diversifying your portfolio with exposure to different sectors and regions is good practice as combined, the varying profiles can provide a reduction in risk while aiming for maximum return (Modern Portfolio Theory).
• Established governments and policies create stability within the region and the stringent corporate governance practices provides transparency into the individual companies.
• Industry strength in areas that Australia may lack, for example: Industrials, Luxury Goods and non-Financial Services such as Hospitality/Tourism.
Important Information
All information contained in this publication is provided on a factual or general advice basis only and is not intended or be construed as an offer, solicitation, or a recommendation for any financial product unless expressly stated. All investments carry risks and past performance is no indicator of future performance. Before making an investment decision, you should consider your personal circumstances, objectives and needs and seek a professional investment advice. Opinions, estimates and projections constitute the current judgement of the author as at the date of this publication. Any comments, suggestions or views presented in this communication are not necessarily those of HALO Technologies, Macrovue or any of their related entities (‘we’, ‘our’, ‘us’), nor do they warrant a complete or accurate statement.
The opinions and recommendations in this publication are based on a reasonable assessment by the author who wrote the report using information provided by industry resources and generally available in the market. Employees and/or associates of HALO Technologies or any of the other related entities may hold one or more of the investments reviewed in this report. Any personal holdings by HALO Technologies or any of the other related entities employees and/or associates should not be seen as an endorsement or recommendation in any way.


